
Finolex Industries’ Q3 Revenue & PAT Flat YoY Despite Increase in Volume
Finolex Industries Limited [NSE: FINPIPE, BOM: 500940], an Indian manufacturer of PVC pipes, conduits and fittings, has made its Q3 FY-25 financials public.
Finolex Industries’ Sales Volume Increases, PAT Flat YoY
In its investor presentation for Q3 FY-25 results, Finolex Industries mentioned that considering Q3 volume of sales, PVC resin grew by 30% Year-over-Year (YoY) whereas PVC pipes and fittings segment grew modestly by 5% YoY. In FY-25, PVC Resin sales volume stood at 56,830 Metric Tonne (MT), whereas PVC pipes & fittings segment’s volume of sales was 85,767 MT. Despite this increase, the company’s Q3 revenue and PAT remained flat YoY.
Commenting on the company’s performance, Mr. Prakash P. Chhabria, Executive Chairman, Finolex Industries Ltd., said, “FIL [Finolex Ind. Ltd.] has registered modest volume growth in Pipes & Fittings volume inspite of weak demand scenario during the quarter. The operating performance of the Company are muted mainly due to weaker realisation”.
Finolex Industries’ Standalone Financials for Q3 FY-25
Finolex Industries earned a standalone revenue of Rs. 1,001.24 crore from operations, and a corresponding Profit After Tax (PAT) of Rs. 70.96.
Finolex Ind.’s Consolidated Financial Performance for Q3 of FY-25
YoY Comparison of Finolex Industries’ Numbers: Q3 FY-25 vs. Q3 FY-24
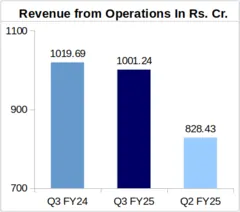
Finolex Industries reported a consolidated revenue of Rs. 1,001.24 crore from operations during Q3 of FY-25 against Rs. 1,019.69 crore in Q3 of FY-24. Therefore, the company’s Q3 revenue remained mostly flat YoY, with a slight decrease of 1.81%.
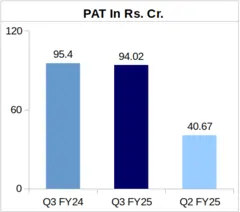
Q3 PAT echoed the same YoY trend, decreasing slightly by 1.45% YoY to Rs. 94.02 crore in FY-25 from Rs. 95.40 crore in FY-24.
Earnings Per Share (EPS) of the company were reported as Rs. 1.52 in Q3 of FY-25 against Rs. 1.54 in Q3 of FY-24.
QoQ Comparison of Finolex Ind.’s Financial Figures: Q3 FY-25 vs. Q2 FY-25
Considering comparison of Finolex Industries’ Q3 FY-25 numbers with Q2 of FY-25 financials of the company, quarterly revenue was up by 20.86% from Rs. 828.43 crore.
Moreover, Finolex Industries’ Q3 FY-25 PAT was 2.31 times its Q2 FY-25 PAT of Rs. 40.67 crore.
Finolex Industries’ Segment-Wise Revenue Comparison: Q3 FY-25 vs. Q3 FY-24
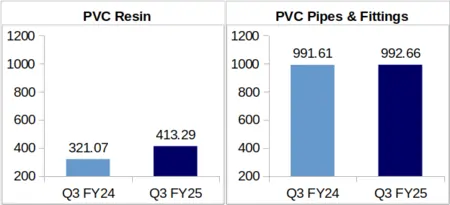
PVC Resin: Finolex Industries logged Rs. 413.29 crore as Q3 FY-25 revenue from its PVC Resin business vertical. This number represents a 28.72% jump from its Q3 FY-24 revenue of Rs. 321.07 crore from this segment.
PVC Pipes & Fittings: Quarterly revenue from this segment remained almost flat YoY. The company earned Rs. 992.66 crore from this vertical in Q3 of FY-25, 0.11% up from Finolex Industries’ PVC pipes and fittings Q3 FY-24 revenue of Rs. 991.61 crore.
About Finolex Industries Limited: Finolex Industries Ltd. is a part of the Finolex Group, which was founded in 1958 by Mr. Pralhad P. Chhabria. The company has three manufacturing facilities, which are located at Ratnagiri and Urse in Maharashtra, and at Masar in Gujarat. The company earned a revenue of Rs. 4,317.43 crore during FY-24.
